

CFO’s Report
A year of integration and regionalisation
This year has been another momentous one for IBL, with revenue surpassing the Rs 120 billion milestone and EBITDA exceeding Rs 12 billion. We have also adjusted our financial reporting, narrowing our focus onto four strategic clusters that better reflect the business models driving our performance.
These results become even more meaningful when viewed in the broader context. FY 2025 was marked by significant external shocks, both on a macro level and in the markets where we operate. Yet, our sectoral and geographical diversification has been a strong asset in mitigating these pressures. It helped us absorb the impact of cost inflation, in particular the sharp increase in labour costs in Mauritius, which has materially impacted a number of our business units.
We have now entered a new phase of development, driven by regional integration, a strong focus on operational excellence, and leveraging synergies and best practices across clusters. As part of this shift, we are continuing our debt reduction and deleveraging efforts to further strengthen our balance sheet. And while we remain open to value-accretive inorganic opportunities, these are increasingly led by the relevant business units themselves. Notable examples this year include UBP’s acquisition of Bazalt Réunion and Phoenix Beverages’ acquisition of Seybrew, which closed after the financial year end. In parallel, we are actively rebalancing our portfolio to unlock value and maintain our strategic flexibility, as seen in the sell-down of 22.4% in AfrAsia, while retaining a 7.89% stake under the leadership of Access Bank UK.
Our Beyond Borders strategy continues to deliver. In FY 2025, 54% of IBL’s revenue and 46% of operating profit were generated beyond Mauritian borders, and international operations drove 72% of our growth. This regionalisation is clearly creating value both in Mauritius and in our overseas operations, enabled by our integrated cluster model: it is allowing us to roll out best practices quickly, realise synergies, and scale our businesses effectively, all while keeping local management fully empowered to manage and grow their businesses.
Looking ahead, the macroeconomic outlook across our key markets is mixed. Mauritius is set to transition into a slower growth environment, with real GDP easing to around 3.3% in 2025. GDP per capita continues to rise, reflecting continued resilience, but at a more moderate pace. Inflation remains broadly contained and relatively steady in a context where the government and central bank have limited levers of action amid a negative rating outlook by Moody’s. That said, Mauritius remains one of the only countries on the continent, alongside Botswana, to have an investment-grade rating, underpinned by strong economic fundamentals.
Kenya’s economic momentum remains steady, with real GDP growth projected at around 4.7% in 2025. Monetary conditions have eased, with a policy rate dropping to single digits, and inflation expected to continue trending downwards to just above 4%. Gains in per capita income are supported by robust growth in services and agriculture, even as fiscal vulnerabilities and external financing pressures remain a concern. Meanwhile, in Réunion, growth is more modest at roughly 2.0% for 2025, though per capita income continues to improve, benefitting from EU transfers and stable social spending.
Performance of the Group
Group Profit or Loss
The table below is an abridged version of the Profit or Loss statement presented in the financial statements
Figures in Rs Million
| Statements of Profit or Loss (Abridged) | ||
|---|---|---|
| Year Ended Audited 30.06.2025 |
Year Ended Audited Restated 30.06.2024 |
|
| Revenue | 120,784 | 101,565 |
| Profit from operations | 7,448 | 5,461 |
| Share of results of associates and JVs | 364 | 505 |
| Other gains and losses | 58 | 1,613 |
| Net finance costs | (3,372) | (3,207) |
| Profit before taxation | 4,499 | 4,372 |
| Taxation | (1,373) | (944) |
| Profit for the year from continuing operations | 3,126 | 3,428 |
| Discontinued operations | ||
| Profit for the year from discontinued operations | 1,856 | 2,163 |
| Profit for the year | 4,981 | 5,591 |
| Profit attributable to: | ||
| Owners of the parent | 3,007 | 2,974 |
| Non-controlling interests | 1,975 | 2,974 |
| Profit for the year | 4,981 | 5,591 |
| Number of shares (Rs'000) | 680,224 | 680,224 |
| Earnings per share (Rs) | 4.42 | 4.68 |
Group revenue
Organic and inorganic growth
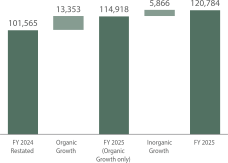
Group revenue for FY 2025 grew by 19%, driven by 13% organic growth and 6% from inorganic expansion. The inorganic growth stems from a full-year contribution from Run Market and Harley’s, compared to only 10 months and 8 months of operations respectively in FY 2024, together with the acquisition and consolidation of Bazalt Réunion (effective 1 July 2024), and the takeover of Clinique du Bon Pasteur from a minority position. PBL’s acquisition of Seybrew in Seychelles marks another key milestone, and will be reflected in the Group’s consolidated accounts in the next financial year. As such, all inorganic growth registered this year relates to transactions announced or completed before the start of the year, with the exception of Clinique du Bon Pasteur, whose impact, while positive, remains marginal.
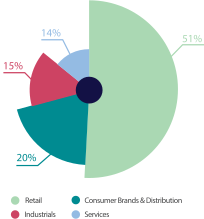
Revenue contribution by cluster
Revenue contribution by geography
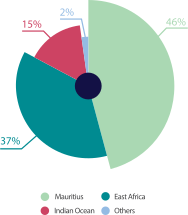
The subsidiaries acquired in East Africa over the past two years contributed Rs 44 billion to Group revenue, underscoring both the scale of our strategic expansion in the region, and the growing impact of our integration efforts. With positive economic momentum, an expanding middle class, and favourable demographics, East Africa continues to offer a compelling platform for long-term growth – one that our operations are very well positioned to capitalise on.
Revenue waterfall (FY 2025 vs FY 2024)
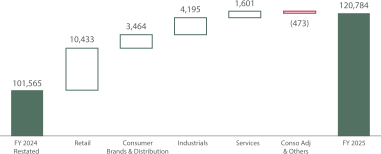
Revenue growth was achieved across all clusters. The Retail and Industrials clusters delivered robust increases of 19% and 28% respectively compared to last year, and Consumer Brands & Distribution and Services also recorded solid year-on-year gains, reflecting balanced momentum across the portfolio.
| Turnover | Retail | Consumer Brands & Distribution | Industrials | Services | Corporate Services | Consolidation Adjustments |
|---|---|---|---|---|---|---|
| FY 2024 | 54,211 | 22,437 | 15,127 | 16,014 | 240 | (6,465) |
| FY 2025 | 64,644 | 25,901 | 19,322 | 17,615 | 248 | (6,946) |
EBITDA
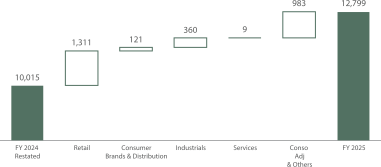
EBITDA waterfall (FY 2025 vs FY 2024)
The Group’s EBITDA rose by 28%, reaching Rs 12.8 billion in FY 2025 from Rs 10.0 billion in FY 2024. This strong performance reflects both the momentum of our core operations and the success of the strategic initiatives pursued in recent years. This growth was led by strong performances in the Retail and Industrial sectors, with additional positive contributions from Consumer Brands & Distribution and Services. The Corporate Services segment also added to the uplift this year, supported by foreign exchange gains in FY 2025 compared to losses in FY 2024. Taken together, all four operational clusters delivered higher EBITDA, underscoring the resilience of the Group's business model.
| EBITDA Margin | Retail | Consumer Brands & Distribution | Industrials | Services |
|---|---|---|---|---|
| FY 2024 | 5.1% | 12.4% | 13.9% | 24.6% |
| FY 2025 | 6.3% | 11.2% | 12.8% | 22.4% |
Taking a closer look, the Retail cluster maintained its growth momentum. Naivas reinforced its leadership position in Kenya by continuing to expand its store network. Run Market achieved double-digit growth and is now generating positive EBITDA, marking an important milestone in its turnaround journey, while Winners also contributed positively despite ongoing cost pressures. It is worth noting that even with lower profit margins, our Retail cluster remains efficient in generating high returns on capital, given its attractive balance sheet structure, which benefits from relatively lower fixed assets and a structurally positive cash cycle.
The Consumer Brands & Distribution cluster showed steady progress. Phoenix Beverages led the way, delivering top-line growth, with regional expansion poised to contribute further through the Seybrew acquisition. BrandActiv posted higher revenues and profitability, driven by stronger volumes and new product launches. Harley's Kenya also reported revenue growth, fuelled by new product lines and more effective distribution.
The Industrials cluster continued to benefit from the strong performance of CNOI, while UBP delivered notable results, bolstered by the acquisition of Bazalt Réunion.
On the other hand, the Seafood segment faced headwinds from raw material shortages, leading to a dip in performance compared to last year. In the Services cluster, both the Hospitality & Property and Financial Services segments remained integral to the cluster's stability, delivering consistent results.
While revenue remains concentrated in the Retail sector, the EBITDA breakdown presents a more balanced picture, suggesting that profitability is well diversified across the Group. The Services Cluster remains one of the largest contributor to EBITDA, at 29%. The Retail & Consumer Brands & Distribution clusters account for 30% and 22%, respectively. The Industrials cluster, which was most hit by rising costs, contributed
Associates
Share of profit from associates/JVs (FY 2025 vs FY 2024)
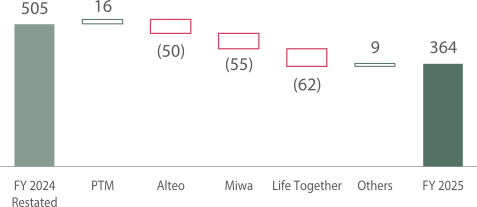
Alteo’s profitability declined due to a weaker performance in the Agro-Business segment, where lower sugar prices and reduced production outweighed the positive results recorded in the Property cluster. Likewise, MIWA’s results were adversely impacted by challenging trading conditions in Tanzania and Kenya. The decline in Life Together stems primarily from the non-recurrence of earnings from an associate disposed of in FY 2024. In contrast, PTM registered an improvement in FY 2025.
It is important to highlight that AfrAsia’s stake was reduced from 30% to 8% after the end of FY 2025, resulting in its classification under Discontinued Operations in the Income Statement for both FY 2024 and FY 2025.
Profit After Tax (TAX)
Year-on-year change in key line items
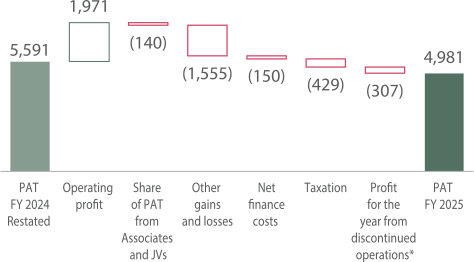
The Group reported a PAT of Rs 5.0 billion in FY 2025, compared to Rs 5.6 billion in FY 2024. While operating profit rose significantly by 36%, this was offset by lower gains recognised in “Other Gains and Losses”. FY 2024 included non-recurring items amounting to Rs 1.9 billion, versus only Rs 104 million in FY 2025. Excluding these exceptional items, the Group’s PAT would have increased by 24% or Rs 0.9 billion.
Additionally, the drop in PAT was impacted by a reduced share of profit from associates and joint ventures, while higher taxation further weighed on the bottom line. The reduction in Profits from Discontinued Operations was mainly due to the lower contribution of AfrAsia. The “Other gains and losses” line now embeds significant changes due to adjustments in the Gross Obligation related to put and call options. This accounting impact has led to notable fluctuations in this item compared to prior periods.
Profit attributable to shareholders
Breakdown of Profit after Tax between Owners of the Parent and Non-Controlling Interests (NCI)
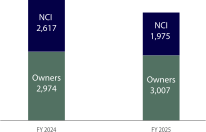
The profit attributable to Owners of the Parent fell by Rs 175 million, or 6%. Excluding the non-recurring items mentioned above, the profit attributable to Owners of the Parent would have seen an increase of 88%, or Rs 1.4 billion. This increase is largely credited to the strong underlying operational performance of our business units.
Group Statement of Financial Position
A summarised version is shown below:
| Statements of Financial Position (Abridged) | ||
|---|---|---|
| Audited As At 30.06.2025 |
Audited Restated As At 30.06.2024 |
|
| Assets | ||
| Property, plant and equipment | 43,903 | 39,091 |
| Investment properties | 3,873 | 4,266 |
| Intangible assets | 17,807 | 16,505 |
| Investments | 14,168 | 15,346 |
| Deferred tax assets | 1,318 | 1,048 |
| Right of use assets | 12,406 | 11,389 |
| Other assets | 171 | 132 |
| Non-current assets | 93,647 | 87,776 |
| Current assets | 41,948 | 39,820 |
| Assets classified as held for sale | 7,211 | - |
| Total Assets | 142,806 | 127,597 |
| Equity and Liabilities | ||
| Equity attributable to owners of the parent | 21,780 | 18,800 |
| Other components of equity | 1,465 | 1,465 |
| Non-controlling interests | 21,045 | 19,925 |
| Total equity | 44,290 | 40,191 |
| Non-current liabilities | 51,660 | 53,004 |
| Current liabilities | 46,710 | 34,402 |
| Liabilities associated with assets classified as held for sale | 146 | - |
| Total Equity and Liabilities | 142,806 | 127,597 |
| Number of shares (Rs'000) | 680,224 | 680,224 |
| Net assets per share (Rs) | 32.02 | 27.64 |
The Group balance sheet expanded by Rs 15 billion, reflecting growth across key asset categories.
Current assets rose by Rs 2.1 billion, moving from Rs 39.8 billion to Rs 41.9 billion, highlighting stronger liquidity and working capital positions. In addition, non-current assets grew by Rs 5.9 billion, reaching Rs 93.6 billion from Rs 87.8 billion, a result of continued investment in longer-term strategic assets. As mentioned earlier, AfrAsia was classified under assets held for sale, amounting to Rs 7.2 billion.
On the liabilities side, total borrowings increased from Rs 38.2 billion to Rs 50.1 billion. This was largely due to the debt taken on by PBL to fund the Seybrew acquisition, though this new entity will only be consolidated as of FY 2026. Additionally, following the completion of the sale of a significant stake in AfrAsia in July 2025, the Group’s financial debt has reduced substantially after the financial year end.
Other current and non-current liabilities grew by Rs 3.4 billion over the period. Conversely, total equity decreased marginally from Rs 44.6 billion to Rs 44.3 billion, mainly due to the accounting impact of put and call options, which cumulatively reduced equity by Rs 4.9 billion. Together, the increase in debt and slight decrease in equity have affected key financial ratios.
| FY 2025 | FY 2024 | |
|---|---|---|
| Gearing | 52% | 49% |
| Return on Equity (RoE) | 12% | 16% |
| Return on Assets (RoA) | 4% | 5% |
| Return on Capital Employed (RoCE) | 8% | 7% |
The increase in the Group’s gearing is due to a combination of rising debt and a modest decline in equity, as explained previously. While this has temporarily elevated leverage, we expect a notable improvement in the ratio next year, following the AfrAsia transaction and the consolidation of Seybrew’s financials. Both Return on Assets (RoA) and Return on Equity (RoE) declined this year, reflecting the drop in profit after tax, as discussed in the income statement section. On the other hand, Return on Capital Employed (ROCE) has increased, highlighting stronger operating profitability and more efficient use of capital employed.
Company Profit or Loss
| THE COMPANY | ||
|---|---|---|
| Year Ended 30.06.2024 Restated |
Year Ended 30.06.2024 |
|
| Dividend Income | 2,056 | 2,296 |
| Other Revenues and Income | 7,792 | 7,331 |
| Total Revenue | 9,849 | 9,627 |
| Cost of Sales | (6,056) | (5,803) |
| Gross Profit | 3,793 | 3,824 |
| Other Income | 278 | 235 |
| Administrative Expenses | (2,272) | (2,136) |
| Exchange Gains / (Losses) | 446 | (424) |
| Depreciation | (97) | (90) |
| Operating Profit | 2,148 | 1,409 |
| Other Gains and Losses | 35 | (179) |
| Net Finance Costs | (1,440) | (1,385) |
| Profit before Taxation | 743 | (155) |
| Taxation | (128) | 99 |
| Profit for the Year | 615 | (56) |
IBL, as a standalone Company, is structured around two main pillars: its operational businesses (principally BrandActiv and HealthActiv) and its investment holding activities. For the year ended 30 June 2025, the Company reported a profit of Rs 616 million, a sharp recovery from the net loss of Rs 56 million recorded in the previous year. The primary driver of this turnaround was a significant swing of approximately Rs 850 million in exchange gains and losses.
Company Balance Sheet
| THE COMPANY | ||
|---|---|---|
| Restated As At 30.06.2024 |
Audited As At 30.06.2025 |
|
| Assets | ||
| Property, Plant and Equipment | 527 | 560 |
| Intangible Assets | 16 | 43 |
| Investments | 46,158 | 41,593 |
| Deferred Tax Assets | 167 | 28 |
| Right of Use Assets | 257 | 256 |
| Non-current Receivables | 188 | 20 |
| Other Assets | 752 | 268 |
| Non-current Assets | 48,066 | 42,768 |
| Current Assets | 4,739 | 4,762 |
| Held for Sale Assets | - | 7,131 |
| Total Assets | 52,804 | 54,685 |
| Equity and Liabilities | ||
| Stated Capital | 1,367 | 1,367 |
| Other Reserves | 20,101 | 21,665 |
| Retained Earnings | 4,365 | 4,408 |
| Total Equity | 25,833 | 27,440 |
| Non-current Liabilities | 20,154 | 12,854 |
| Current Liabilities | 6,818 | 14,391 |
| Liabilities Associated with Assets Classified as Held for Sale | - | - |
| Total Equity and Liabilities | 52,804 | 54,685 |
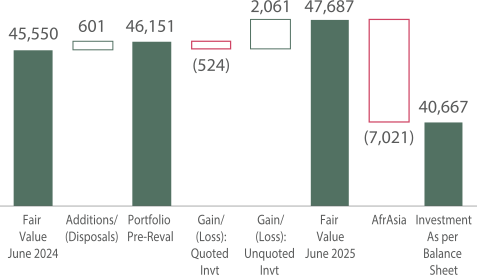
The Company’s total assets increased from Rs 52.8 billion in FY 2024 to Rs 54.7 billion in FY 2025, signalling continued stability in its financial position. The decline in the value of investments is explained by the recognition of AfrAsia as an asset held for sale, amounting to Rs 7.0 billion.
On the liabilities side, while overall debt levels were stable, approximately Rs 7 billion shifted from non-current to current liabilities as these obligations as at 30 June 2025 mature within one year. Following the financial year-end, the majority of this short-term debt was repaid using proceeds from the AfrAsia transaction (completed in July 2025), and the remaining USD-denominated debt was refinanced through a new long-term, multi-currency facility.
Total equity strengthened to Rs 27.4 billion, supported by higher retained earnings and reserves. Overall, the balance sheet remains solid, with a stronger equity base and the strategic reclassification of AfrAsia marking a key development during the year.
Company Investment Portfolio
Year-on-Year Movement
Cluster composition and portfolio rebalance
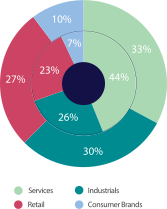
Following the recent clusterisation exercise, the Group’s portfolio is more evenly balanced across its four clusters. The Services cluster remains the largest contributor, representing 33% of the portfolio, driven by strong positions in financial services (DTOS, Eagle Insurance), alongside the Hospitality & Property segment (Lux Island Resorts, Bloomage, The Lux Collective) and the Logistics sub-cluster. As part of the portfolio realignment, AfrAsia has been removed from the Services cluster and reclassified as an Asset Held for Sale.
The Industrials cluster makes up 30% of the portfolio, with UBP and CNOI as its main contributors. The Retail cluster, at 27%, is shaped by both domestic operations such as Pick & Buy (operating under the Winners banner), and international retail chains including Naivas and Run Market.
Finally, the Consumer Brands and Distribution cluster has increased to 10% of the portfolio, adding further diversification through its wide range of distribution networks and brand-driven businesses.
Borrowings
The following chart illustrates the evolution of the Company's borrowings over the past five years.
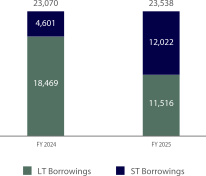
The rise in short-term borrowings primarily results from the reclassification of long-term debt that now falls due within the next year. As mentioned earlier, the majority of these short-term borrowings were repaid or extended after the financial year-end, which will reduce finance costs in the income statement, and strengthen the company's financial ratios. Additionally, Rs 2.5Bn of debt was temporarily classified as short-term, pending a debt covenant waiver letter for one of our subsidiaries which was received after 30 June 2025. Despite this shift in maturity profile, overall borrowings have increased only marginally, and the Company's financial position remains solid.
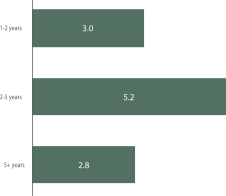
The following chart illustrates the maturity profiles for FY 2024.
Company shareholder information
| Dividend per Share to IBL Shareholders (Rs) | |
|---|---|
| FY 2025 | FY 2024 |
| 0.76 | 0.73 |
| Interim: 0.20 | Interim: 0.18 |
| Interim: 0.56 | Interim: 0.55 |
| FY 2025 | ||
|---|---|---|
| Return to Shareholders | Rs | % |
| Capital Depreciation | (10.00) | (25.00%) |
| Dividend Received | 0.76 | 1.90% |
| Holding Period Return | (9.24) | (23.10%) |
| Share Price 30 June 2025 (Rs) |
Lowest (Rs) | Highest (Rs) | No. of Shares | Market Cap (Rs) |
|---|---|---|---|---|
| 30.00 | 30.00 | 42.05 | 680,224,040 | 20.4 Bn |
| Highest Volume Traded on Any Day |
Average Daily Volume Traded |
Total Shares Traded in FY 2025 |
% of Shares Traded in One Year |
% of Shares Traded on a Daily Basis |
|---|---|---|---|---|
| 1,077,112 | 24,125 | 5,910,672 | 0.869% | 0.004% |
Conclusion
The Group today stands as an undisputed regional force, firmly anchored in Mauritius, and expanding with purpose in high-growth markets in the region. Our diversified portfolio of businesses provides a very strong and resilient platform for long-term growth and value creation.
This journey is made possible by the strength of our partnerships - with teams, entrepreneurs, suppliers, and institutions - who share our ambition and values. Together, we are not only building successful businesses, but also working to fulfil the daily needs of millions of people, and contribute meaningfully to our markets.
We are proud to drive this value creation alongside strong local and international partners, for the benefit of all our stakeholders.